- Bitcoin (BTC) slide 10.9 Percent
- Bitstamp flag a large sell order that caused a market imbalance, over-pricing BTC
Not surprising, Bitcoin (BTC) prices are under pressure, dropping 10.9 percent in the last day, at the time of writing. Analysts attribute this to a large sell order from Bitstamp that forced prices to fall as supply exceeded demand.
Bitcoin Price Analysis
Fundamentals
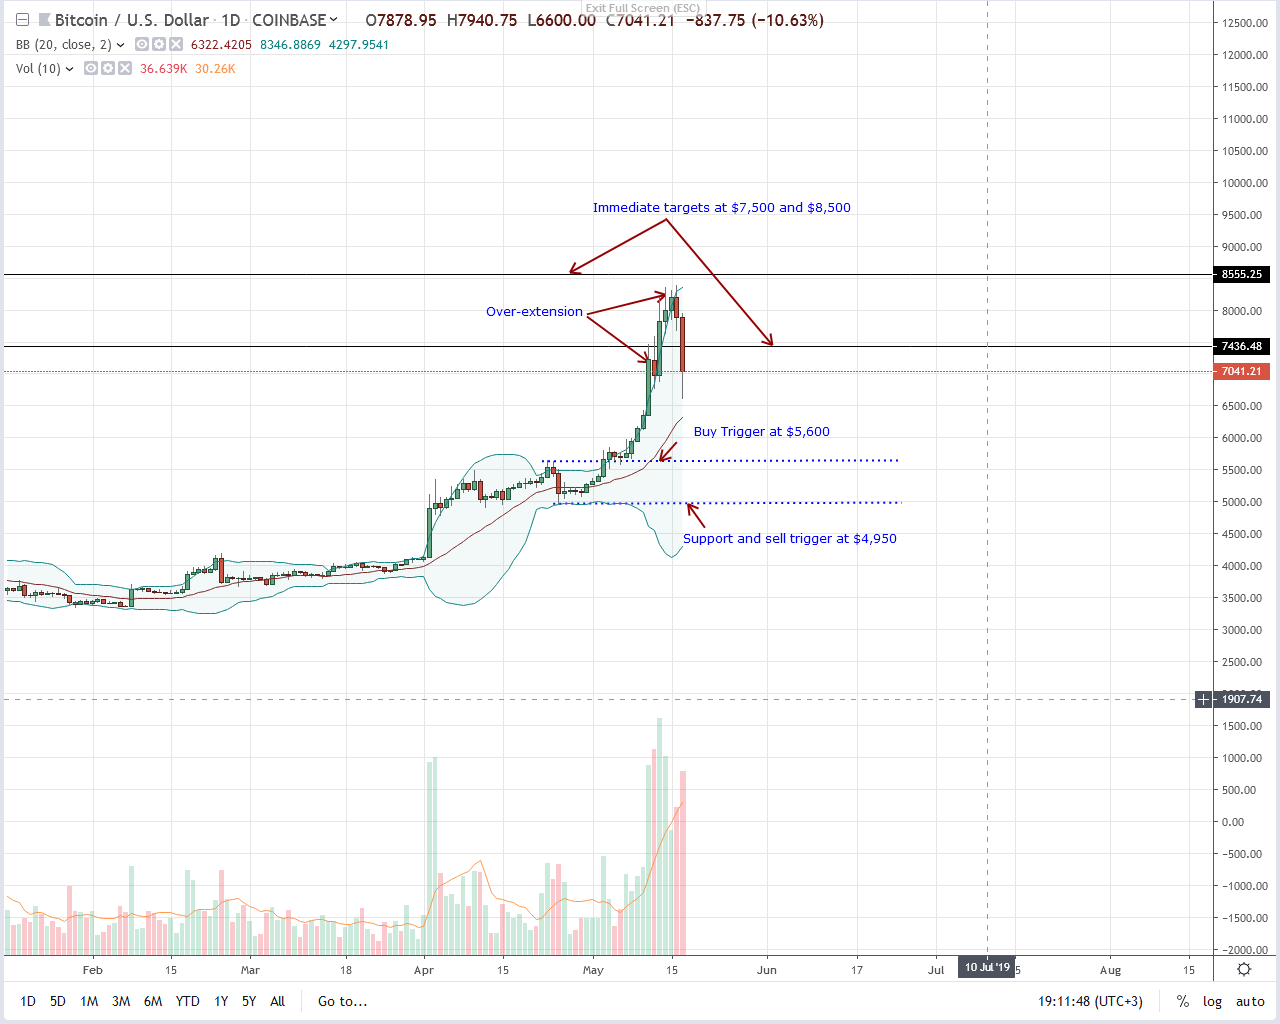
In a day marked by chaos and investors jostling to liquidate Bitcoin (BTC) at market rates, the asset price dropped by $1,340. By sliding from intra-day highs of $7940 to lows of $6,600, the dip is the largest in more than a year.
Nonetheless, today’s slip is but a minor blip mainly because candlestick arrangement favors buyers. This is all thanks to increasing transaction volumes and general awareness of what BTC represents. Coincidentally, the drop is two days after keen observers noted a sharp increment in the number of retail investors/traders owning more than 1 BTC.
Even so, the majority are crypto exchanges. All the same, this is bullish and reveals optimistic participants keen on accumulating in readiness for the next wave of higher highs that would most likely lift Bitcoin above 2017-18 peaks probably towards $50k as per Arthur Hayes projection.
Candlestick Arrangement

From the chart, Bitcoin (BTC) is down 10.9 percent in 24 hours but up 15.8 percent from last week’s close. Even though buyers are technically in charge thanks to favorable price action and a stellar performance in the previous six weeks when prices surged 75 percent after breaching $4,500, today’s unloading is likely a correction.
Already, what we have is a double bar bear reversal pattern. Because of today’s losses, May-16 bears are back. As such, in days ahead, the path of least resistance will likely be southwards. In that case, risk-off traders can exit their longs, fade the primary trend, and aim for Apr-2019 highs of $5,600 in line with our last BTC/USD trade plan.
Technical Indicator
Our anchor bar is May-13 with 47k against 21k averages. However, because of BTC over-valuation in the last few days, BTC prices will likely dip below May-13 lows as sellers flow back albeit with light volumes. That will correct the over-extension with probable support at the 20-day MA on the upper end or $5,600 on the lower end.
Chart courtesy of Trading View. Image Courtesy of Shutter Stock


